Gardens of the Anthropocene
Augmented Reality Installation in public space by Tamiko Thiel, 2016 - 2017Originally commissioned for the Seattle Art Museum Olympic Sculpture Park in summer 2016
Project Background
The following links have been compiled with the help of University of Washington Professors Josh Lawler and Julian Olden. As co-directors of the Center for Creative Conservation they foster creative and meaningful approaches to conservation and sustainability, including EarthGames, dedicated to making environmental change through games.NOTE: Any mistakes or misinformation are entirely the fault of the artist!
Climate change links:
Over the course of the last year, approximately every three months new articles come out saying the previous reports need to be amended as their predictions have already become exceeded. Professors Lawler and Olden have confirmed in personal conversations that temperatures already seem to be changing in a non-linear manner. The following texts therefore cite the upper bounds on the temperature predictions in the following articles, expecting that the predictions will be superceded shortly as well.
Temperatures:
The University of Washington Climate Impacts Group published a report: "State of Knowledge: Climate Change in Puget Sound," which was most recently updated In April, 2016. According to page 2-13 of Section 2, "How Is Puget Sound's Climate Changing?" relative to temperatures in the period 1970-1999
- by 2050 average annual temperatures in the Seattle area could rise by 5.5°F (range 4.3°-7.1°F = 2.4°-3.9°C)
- by 2100 average annual temperatures could rise by 9.1°F (range 7.4°-12°F = 4.1°-6.7°C).
- Rainfall will be more erratic, could increase in winter but decrease in summer.
As pointed out by 22 scientists in the article Consequences of twenty-first-century policy for multi-millennial climate and sea-level change, (Peter U. Clark et. al, www.nature.com, 8 Feb. 2016):
- "twenty-first century global average warming will substantially exceed even the warmest Holocene conditions, producing a climate state not previously experienced by human civilizations." (Emphasis added. See bottom of p. 361, continued on p. 363.)
This graph from wikipedia gives an overview of tempertures during different geologic epochs:
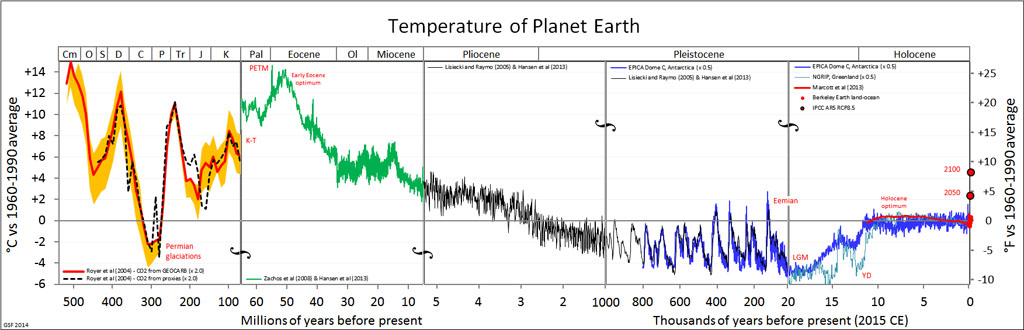
Source: Glen Fergus,
https://en.wikipedia.org/wiki/Geologic_temperature_record
Sea levels:
When I started this project the University of Washington Climate Impacts Group report "State of Knowledge: Climate Change in Puget Sound," updated April, 2016 (Section 4, "How will Climate Change Affect Sea Level?" p. 4-12.), projected water level rise for Seattle could be up to 19" (1.6') by 2050 and up to 56" (4.7') by 2100 (relative to 2000). These levels will be exacerbated during storm surges. See also: Seattle Public Utilities Projected Climate Changes.
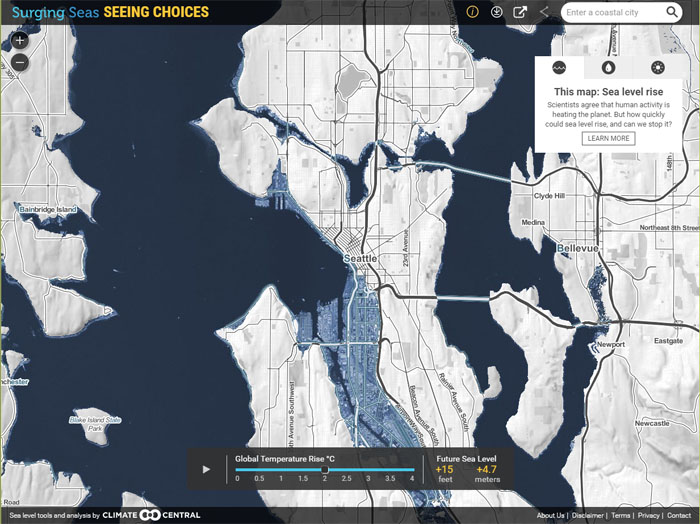
UPDATE: global sea level rise interactive map:
As mentioned, every several months prediction updates exceed the previous warnings. By November 2016, it is clear that we have already locked in a temperature rise globally for 2100 at the latest of at least 2.7°F (1.5°C), with the EPA saying there is a potential rise of 8.6°F (4.8°C) globally and for the USA 12°F (6.7°C).
According to this Climate Central interactive map of temperature rise + water level rise, this gives a minimum rise mow of 15' (4.7m) water level:
We have started a process of global warming that, even if we stopped all carbon emissions immediately, will have lasting effects over thousands of years and will produce a planet that looks very different from the one we inhabit now (see article in www.nature.com below). Check out the interactive maps for your areas at:
Lasting effects of current carbon emissions:
Also drawing on the article Consequences of twenty-first-century policy for multi-millennial climate and sea-level change, (Peter U. Clark et. al, www.nature.com, 8 Feb. 2016):
- Anthropogenic increases in CO2, however, have effects that extend well beyond 2100; a considerable fraction of the carbon emitted to date and in the next 100 years will remain in the atmosphere for tens to hundreds of thousands of years. ... past, present and future emissions commit the planet to long-term, irreversible climate change." (Page 360).